








Introduction à Naive Bayes
Leçon 12 sur 19 du cours Introduction à l’apprentissage automatique de Coddy.
Naive Bayes est un algorithme simple mais puissant utilisé pour les tâches de classification en apprentissage automatique (machine learning).
L'algorithme Naive Bayes est basé sur le théorème de Bayes, qui nous indique comment calculer la probabilité d'un événement (comme un e-mail étant un spam) sur la base de connaissances préalables des conditions qui pourraient être liées à l'événement. La partie « naïve » provient de l'hypothèse selon laquelle toutes les caractéristiques (comme les mots dans l'e-mail) sont indépendantes les unes des autres, ce qui simplifie les calculs. Être indépendant signifie que le fait qu'une chose se produise ne modifie pas les chances qu'une autre chose se produise.
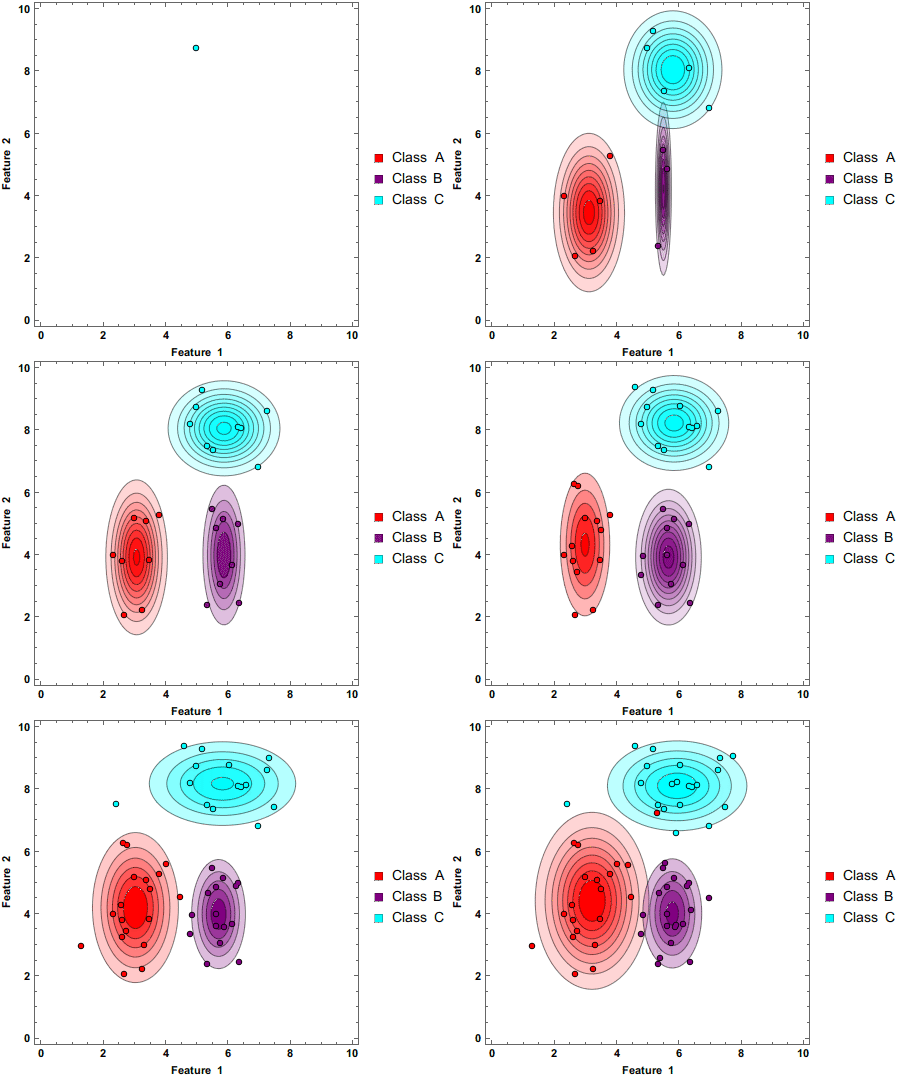
Source : Wikipedia, un classificateur Naive Bayes mettant à jour son estimation à mesure que davantage de données lui sont fournies.
Voici comment cela fonctionne :
- Compter les occurrences : Tout d'abord, comptez combien de fois chaque point de données apparaît dans différentes classes. Dans la détection de spam par e-mail, nous compterons combien de fois chaque mot est apparu dans des e-mails de spam ou non, dans le diagnostic médical, nous pourrions compter combien de fois (ou pendant combien de temps) chaque symptôme apparaît.
- Calculer les probabilités : Pour un nouveau point de données, calculez la probabilité d'appartenir à chaque classe (quelle est la probabilité qu'un nouvel e-mail soit un spam et quelle est la probabilité qu'il ne le soit pas)
- Décision : Enfin, l'algorithme combine toutes ces probabilités à l'aide du théorème de Bayes et décide si l'e-mail est plus susceptible d'être un spam ou non. Plus la probabilité est élevée, plus il est probable qu'il appartienne à cette classe.
Ce qui est génial avec Naive Bayes, c'est sa mise en œuvre rapide et facile. Il fonctionne bien avec des données de grande dimension (comme le texte) et peut gérer les valeurs manquantes. Cependant, l'hypothèse d'indépendance n'est pas toujours vraie dans la vie réelle, ce qui peut parfois conduire à des résultats moins précis par rapport à des algorithmes plus complexes.
 Testez-vous
Cette leçon comprend un petit quiz. Commencez la leçon pour y répondre et suivre votre progression.
Testez-vousCette leçon comprend un petit quiz. Commencez la leçon pour y répondre et suivre votre progression.
Testez-vousCette leçon comprend un petit quiz. Commencez la leçon pour y répondre et suivre votre progression.

Défi
MoyenDans ce défi, nous allons apprendre à calculer la probabilité d'appartenir à une classe particulière. Le jeu de données play_outside.csv contient les colonnes suivantes : temperature, mood, motivation, windy, play. Chaque ligne représente la même personne et indique si elle a décidé de jouer à l'extérieur ou non en fonction des caractéristiques (temperature, mood, motivation, windy). Notre objectif est de prédire si elle ira jouer à l'extérieur en fonction des caractéristiques (temperature, mood, motivation, windy).
Voici un exemple de jeu de données :
| temperature | mood | motivation | windy | play |
| low | good | high | no | yes |
| moderate | good | high | no | yes |
| low | low | medium | yes | no |
Les équations suivantes peuvent sembler intimidantes, mais nous allons les décomposer.
Formule de Naive Bayes : P(Class|Feature) = P(Feature|Class) * P(Class) / P(Feature)
- P(Feature|Class) - Vraisemblance (Likelihood)
- P(Class) - Probabilité a priori de la classe
- P(Feature) - Probabilité a priori du prédicteur
- P(Class|Feature) - En d'autres termes, quelle est la probabilité que la ligne non vue soit classée dans la classe
<strong>x</strong>.
Pour résoudre cela, nous devrons calculer chacun des composants de la formule (P(B|Class) * P(Class) / P(B))
- P(Class) - Probabilité a priori de la classe
Cela correspond au nombre d'occurrences de chaque classe, divisé par le nombre total de classes. Par exemple, dans notre exemple de 3 lignes, il y a2/3de yes et1/3de no.P(yes) = 2/3P(no) = 1/3 - P(Feature|Class) - Vraisemblance
Cela correspond au nombre d'occurrences de chaque caractéristique pour une classe donnée. Par exemple :P(temperature = <strong>low</strong>|play = <strong>yes</strong>)- Il y a deux lignes oùplay = yes, et une ligne oùtemperature = low(parmi seulement les lignes oùplay = yes), donc cela est égal à1/2. - P(Feature)
Cela correspond au nombre d'occurrences de chaque caractéristique divisé par le nombre total de lignes. Par exemple :p(motivation=high) = 2/3car il y a deux lignes avec une motivation élevée divisées par le nombre total de lignes (3)
Le défi
On vous donne deux dictionnaires probability_features, probability_target et le dataset_name
Calculez pour chaque caractéristique (colonne) la probabilité de chaque attribut.
Par exemple, voici la valeur de probability_target :
probability_target = {
    "yes": 0.66667, # (2/3)
    "no": 0.33333 # (1/3)
}
Voici la valeur de probability_features :
probability_features = {
	"temperature": {
		"low": {
			"yes": 0.5, # (1/2)
			"no": 0.5, # (1/2)
		},
		"moderate": {
			"yes": 1, # (1/1)
			"no": 0, # (0/1)
		}
	}
}
Gardez à l'esprit que les noms des caractéristiques et les noms des attributs ne sont pas constants. Chaque jeu de données a des caractéristiques différentes et des noms différents.
Je recommanderais d'utiliser le module pandas pour faciliter les calculs.
Essayez vous-même
import pandas as pd
probability_features = {}
probability_target = {}
dataset_path = input()
target_variable = input()
df = pd.read_csv(dataset_path)
# Écrivez votre code ici


# -------------------- Trier et afficher --------------------
# Ne pas modifier ce qui suit
sort_features = {q: {k: v for k, v in sorted(a.items() if a != None else {}, key=lambda item: item[0])} for q, a in sorted(probability_features.items(), key=lambda item: item[0])}
sort_target = {k: v for k, v in sorted(probability_target.items(), key=lambda item: item[0])}
print(sort_features)
print(sort_target)Toutes les leçons de Introduction à l’apprentissage automatique
1Le début du parcours en ML
Introduction au MLLes données à fournir à un modèleQu’est-ce qu’un modèle de ML ?

Entraînez-vous par vous-même : Compilateur Python en ligne